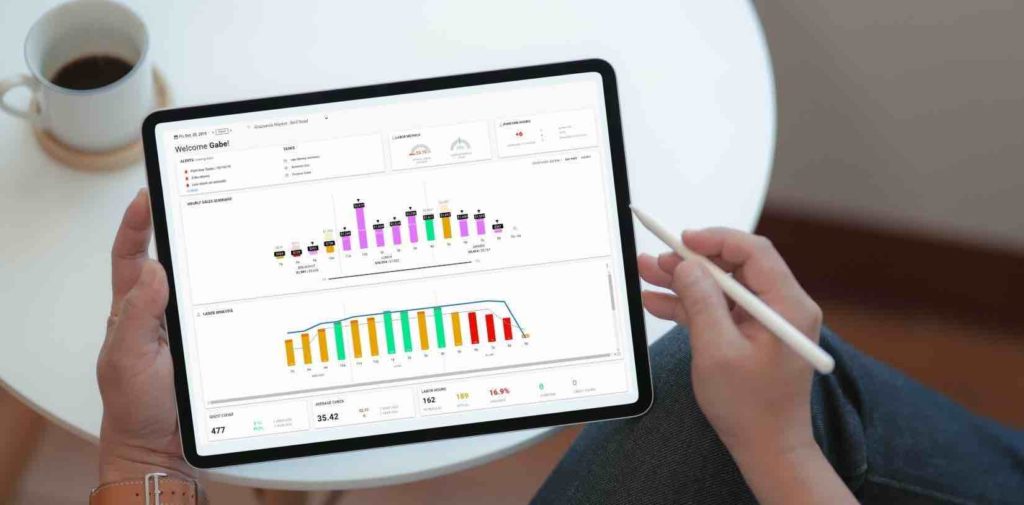
...dashboard displays the forecasted sales and labor against the actual sales and labor data polled in from your daily sales summary. When the daily sales
...will provide valuable insights into sales trends and labor costs, enabling you to make data-driven decisions that improve overall performance. LEARN MORE ABOUT BACK OF
...line: financial and operational reporting. What POS integration means for financial reporting 1. Daily sales summary A POS-integrated platform creates transactions within your restaurant accounting
...it comes to looking at your revenue. Beyond looking at the overall sales, examine your dine-in sales versus delivery versus takeout versus drive-thru. Use your
...Restaurant sales forecasting draws from historical sales data in a similar period to project future sales. It is an informed estimate that uses past sales
...and actual shift count Scheduled and actual wages Scheduled and actual hours Gross sales by server Gross sales by hour Sales & Product Mix Dashboard
...– A high-level snapshot of daily sales, labor, and comps that helps managers make real-time adjustments. Weekly Sales Review by Location – Breaks down weekly
...– A high-level snapshot of daily sales, labor, and comps that helps managers make real-time adjustments. Weekly Sales Review by Location – Breaks down weekly
...their true labor cost. Total sales: Prime cost percentage is calculated against total net sales, meaning revenue after voids, comps, and discounts. Using gross sales
...as sales, is calculated by pulling from your sales data in your Point of Sales (POS) system. This process is usually automated through your restaurant
...– A high-level snapshot of daily sales, labor, and comps that helps managers make real-time adjustments. Weekly Sales Review by Location – Breaks down weekly
...Other key labor data that are critical for optimizing your labor costs include sales per labor hour (SPLH), which plots your labor hours alongside your
...– A high-level snapshot of daily sales, labor, and comps that helps managers make real-time adjustments. Weekly Sales Review by Location – Breaks down weekly
...– A high-level snapshot of daily sales, labor, and comps that helps managers make real-time adjustments. Weekly Sales Review by Location – Breaks down weekly
Restaurant365 brings together accounting, operations, scheduling, and more in a flexible platform—empowering restaurants to choose the solutions they need and scale with confidence.